GIS analysis to identify focus crops
Introduction
A GIS analysis based on available soil and crop maps of Flanders was performed to identify areas of interest. The locations where the water levels are naturally high could be more affected by rising groundwater levels due to their poor drainage. Poorly drained soils were defined according to the drainage classes in the Soil Belgian Map. The dominant soil types and land cover types in these areas allow to select the most relevant crops and soil types to be modelled. The identification of these areas was also used to target interested parties such as farmers so that we could obtain their valuable feedback on the project methodology.
The dominant crops in poorly drained soils were identified as follows:
- Define “poorly drained soils” based on the drainage classes given in the Belgian Soil Map.
- Extract the areas with soils that meet the definition of poorly drained soils.
- Intersect the land cover map with these poorly drained areas.
- Combine this resulting map with the map of the Flemish provinces to have the area of crops per province in poorly drained soils.
Materials and Methods
The analysis was done using soil and land cover maps collected from Geopunt Vlaanderen and the software QGIS 3.22. The Digital Soil Map of the Flemish Region VPO, 2017, scale 1:20000, contains the soil texture according to the Belgian textural classes, drainage status and profile development of the soil. The Agricultural Use Plots map LV, 2016 contains the overview of the parcels with agricultural use, wooded areas and agricultural infrastructure. Four agricultural use maps for subsequent years; 2018, 2019, 2020 and 2021 were used in order to estimate the average crop surface. All this information is managed by the Database of Subsoils Flanders (DOV) and can be also consulted there.
In addition, we asked the Flemish Environment Agency (VMM) to report the location of areas where rewetting is on the agenda in the context of the Blue Deal plan. They provided us with four Blue Deal flagship projects: Dune complex, Zwarte Beek, Kleine Nete and River recovery Leie.
Digital Soil Map of the Flemish Region
The soil map of Belgium is defined according to soil texture, drainage status and profile development. The soil series and their notation are established based on the combination of these properties’ classes. Soil texture classes are based on the relative clay, silt and sand fractions. The drainage classes depend on the depth of redoximorphic mottling and/or reduction colors occurrence. The soil profile development classes are based on visual identification of soil horizons. The Flemish region has more than 4000 different soil types Dondeyne et al., 2014.
The seven soil texture classes are wider than the ones defined in the standard USDA Soil Taxonomy system (Figure 1). There are also differences in the ranges of particle size for silt and sand categories. In addition of the seven main classes, three extra classes are defined for special cases, G for gravel, V for saturated peat soils by groundwater, and W for saturated peat soils by rainwater.
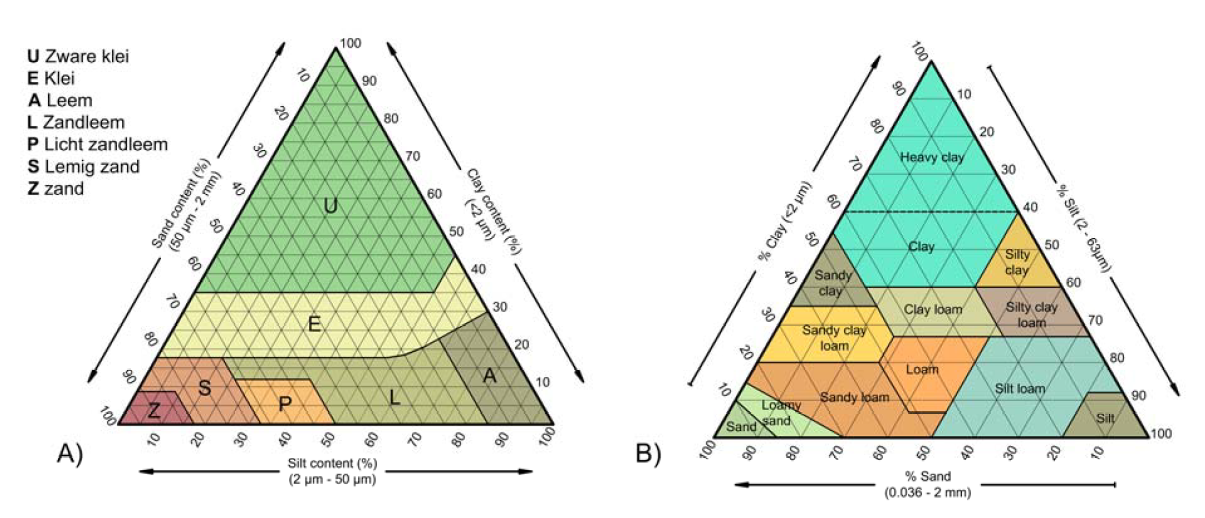
Figure 1:Textural classes according to the Belgian textural classes (A) and USDA textural classes (B). Adapted from Dondeyne et al. (2014)
There are six drainage classes for the cases of deep groundwater and three classes for shallow groundwater (Table 1). Distinction in depth of occurrence of mottling and reduction colors is made between the silty and clayey textures and the sandy textures. Finally, there are eleven classes of soil profile development. For example, a soil type Pca refers to a light sandy loam (P), moderately well drained (c) and a profile development corresponding to a B horizon (a).
Table 1:Drainage classes and symbols according to the legend of the soil map of Belgium Dondeyne et al., 2014
Symbol | Definition | Depth of occurrence (cm) | |||
Silty & Clayey textures (A, L, E, U) | Sandy textures (A, S,P) | ||||
Redoxmorphic mottling | Reduction colors | Redoxmorphic mottling | Reduction colors | ||
No groundwater within 125 cm of soil surface | |||||
a | Excessively drained | - | - | >120 | - |
b | Well drained | - | - | 90-120 | - |
c | Moderately well drained | >80 | - | 60-90 | - |
d | Imperfectly drained | 50-80 | - | 40-60 | - |
h | Poorly drained | 20-50 | - | 20-40 | - |
i | Very poorly drained | 0-20 | - | - | - |
Groundwater present within 125 cm of soil surface | |||||
e | Poorly drained | 20-50 | >80 | 20-40 | >100 |
f | Very poorly drained | 0-20 | 40-80 | 0-20 | 50-100 |
g | Extremely poorly drained | 0 | <40 | 0 | <50 |
Agricultural Use Plots
The agricultural use plots map contains thirteen main categories, from which eight correspond to arable crops (Table 2). Each category comprises several more detailed subcategories of crops.
Table 2:Crops categories in the agricultural use plots map.
Category | Crop |
|---|---|
Potatoes | Early potatoes, storage (industrial) potatoes and seed potatoes |
Fruits and Nuts | Pear, apple, strawberries, … |
Cereals, seeds and legumes | Winter wheat, summer wheat, winter barley, … |
Grassland | Grassland, natural grassland, turf, … |
Vegetables, herbs and ornamental plants | Chicory root, onions, cauliflower, brussels sprouts, spinach, carrot, salad sorts, … |
Woody crops | Deciduous trees, poplars, forest and edge plants, … |
Agricultural infrastructure | Stables and sheds |
Maize | Silage maize and grain maize |
Other crops | Cut rye, floral mixture, tobacco, … |
Sugar beet | |
Flax and hemp | |
Fodder | Grass clover, grass lucerne, alfalfa, fodder beet, … |
Water |
Determination of the dominant soil and crop types in poorly drained soils
All the areas with poor to extremely poor drainage conditions, (classes h, i, e, f , g) and combinations of these classes (Table 1), were considered as poorly drained areas and extracted from the soil map. The land cover map for each year (2018-2020) was intersected with the obtained poorly drained soils layer. Finally, the resulting maps were crossed with the map of the Flemish provinces obtained from the Atlas of Belgium, to have the total area of crops per province.
Results and Discussion
Figure 2 shows the areas with poor drainage over Flanders, together with the location of the four Blue Deal Flagship projects. Most of the soils with low drainage capacity or where the groundwater level is shallow, are located in the province of Antwerp, and some parts of West Flanders and Limburg.
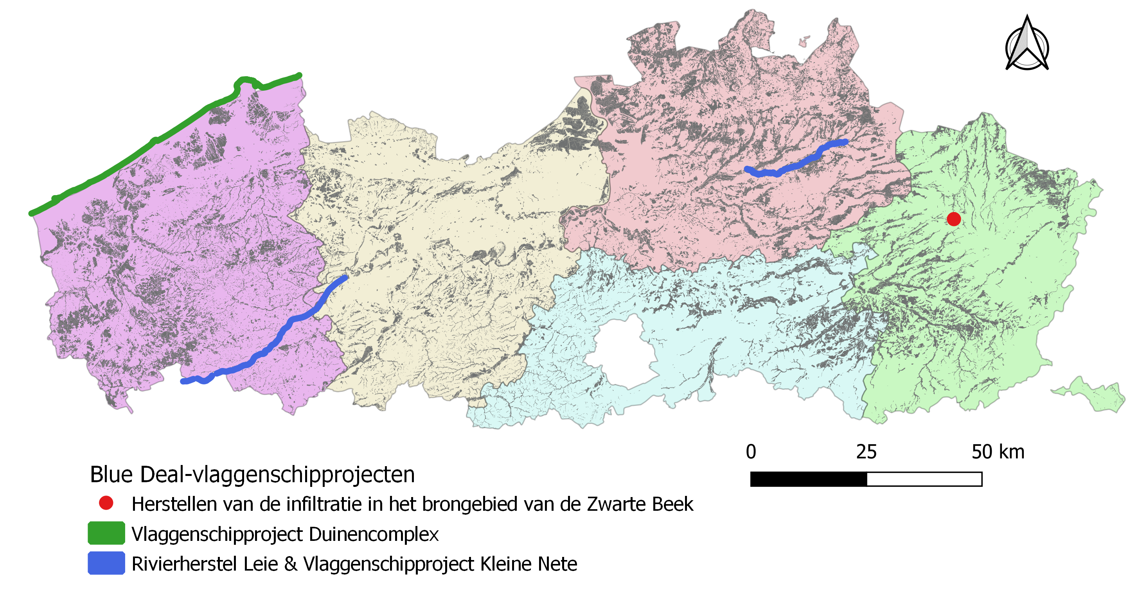
Figure 2:Poorly drained soils (grey) in Flanders and the location of the four Blue Deal Flagships projects.
The dominant soil textures in these soil types are sandy loam (24 %) and loamy sand (20 %) (Figure 3). Light sandy loam, sand and clay cover each around 14 % of the area. Other textural classes appear in less than 3 % of the area.
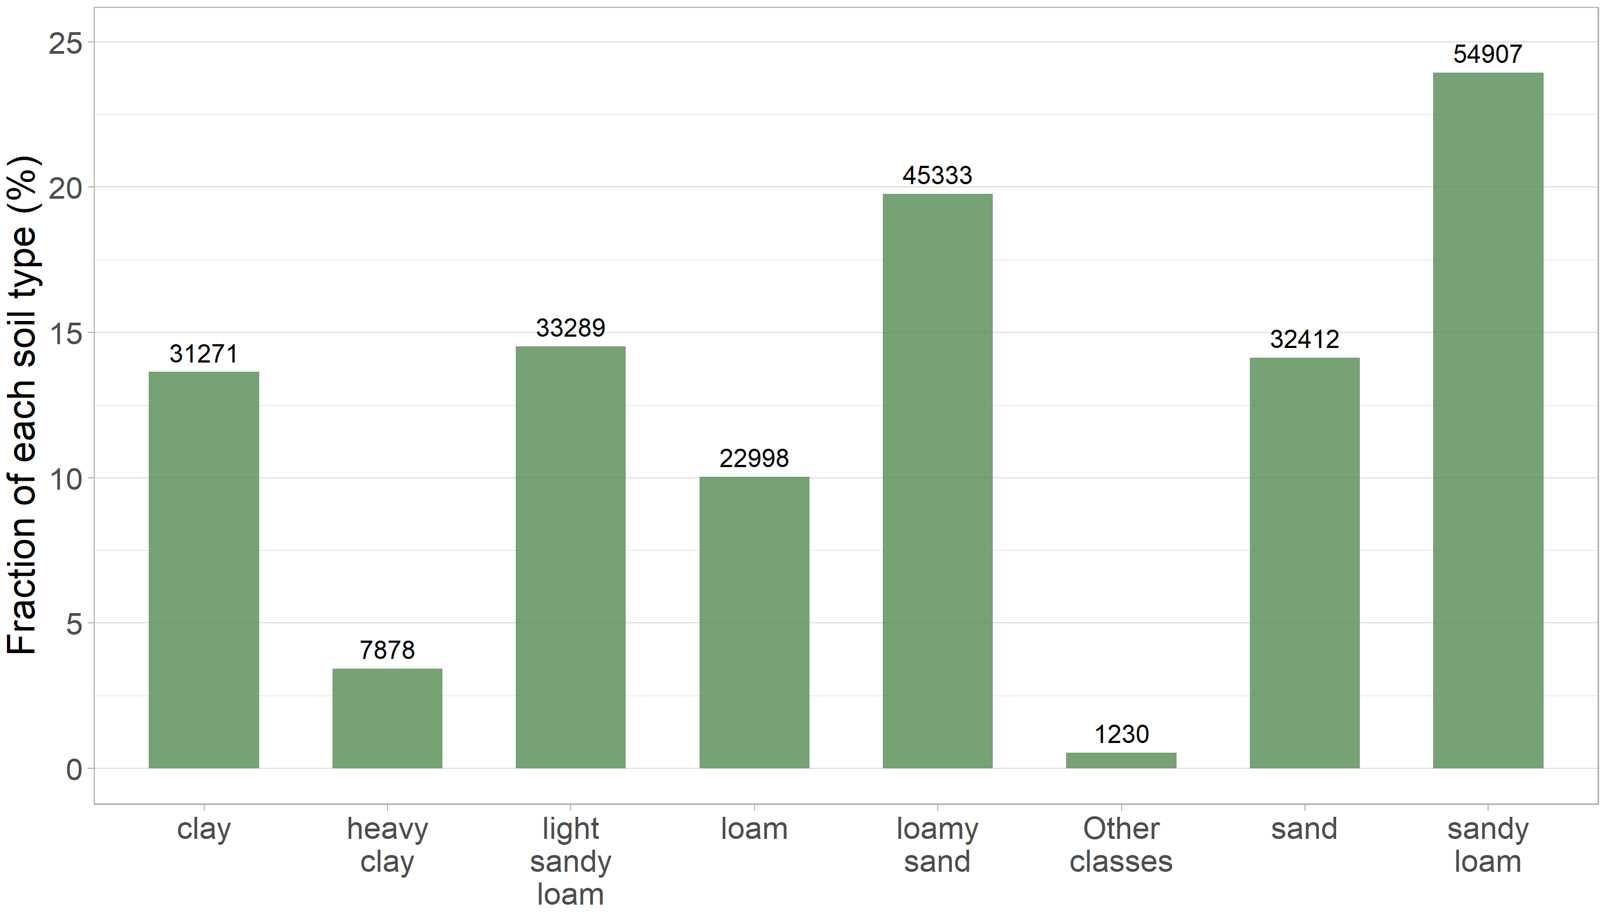
Figure 3:Dominant soil texture classes in poorly drained soils over Flanders. The value on top of each bar represents the area in hectares.
Regarding crop types, Figure 4 shows the 4-year (2018 -2021) average area of each crop per province, according to the crop categories shown in Table 2. The total cultivated area in poorly drained soils is about 123970 ha. The dominant crop categories in all provinces are grassland, maize and potatoes. Antwerp has the largest area of grassland and maize over Flanders, while potatoes are largely found in West Flanders. Vegetables and cereals are also mostly cultivated in West Flanders.
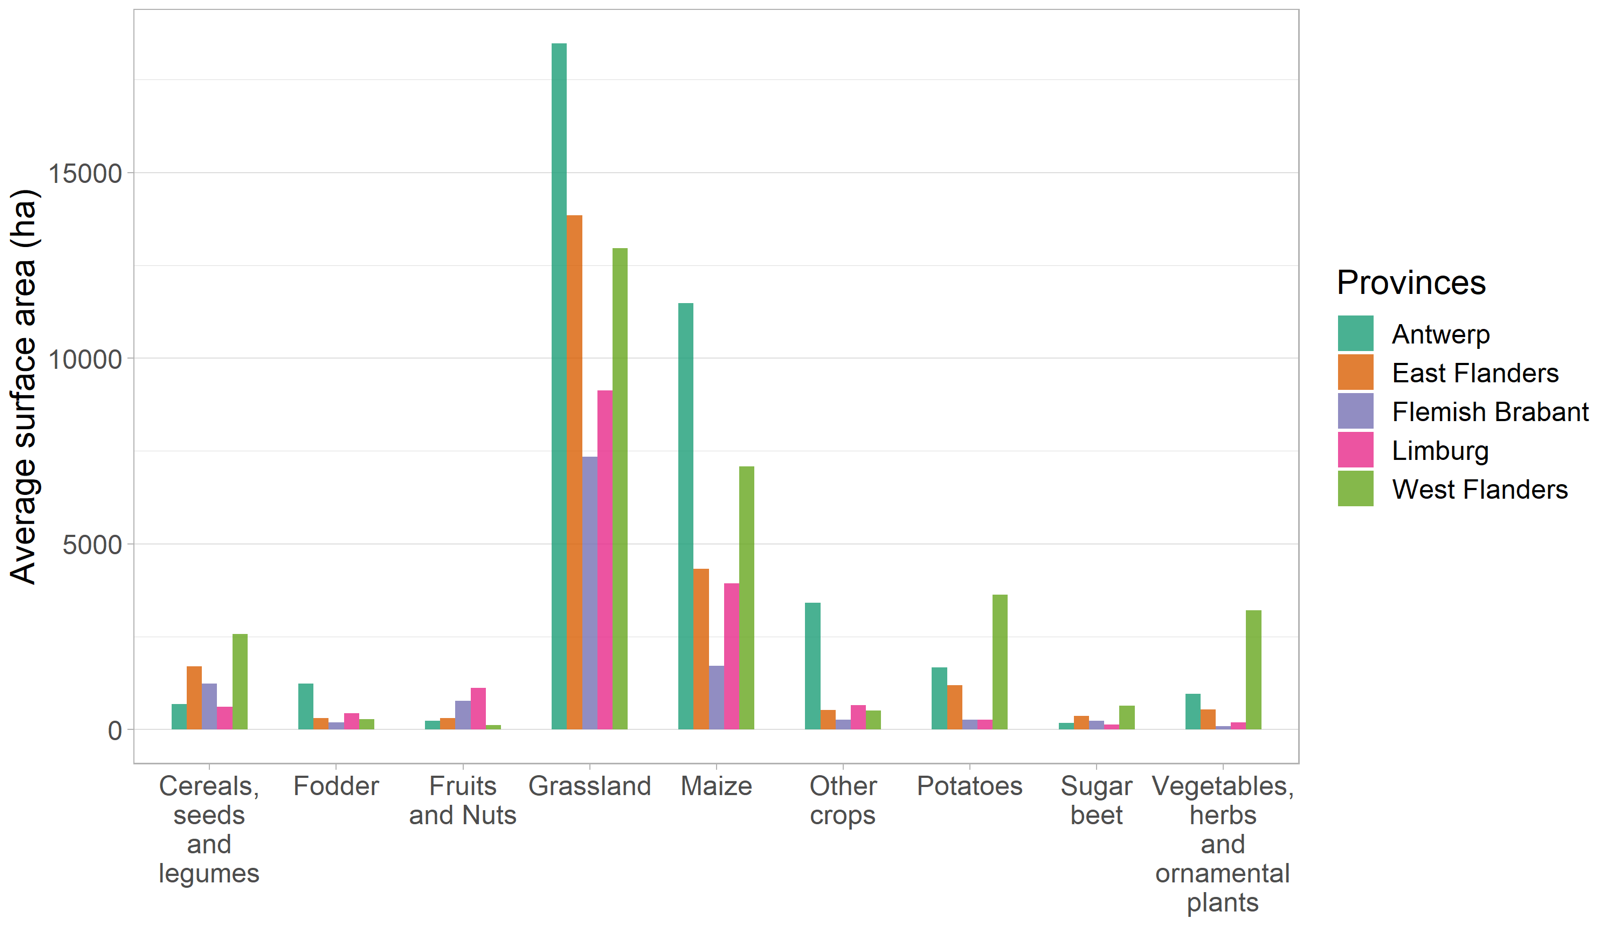
Figure 4:Four-year (2018-2021) average surface area of crops cultivated in poorly drained areas over Flanders per province.
The 4-year average crop area, according to the crop classification of Table 2, also indicates that from the total cultivated area in poorly drained soils, grassland and natural grassland cover almost half of it (Figure 5). Silage maize is the second crop grown in these areas (18 %), while industrial potatoes, grain maize, clover and winter wheat share a similar percentage (4-5 %). Sugar beet and pear are also found in few areas.
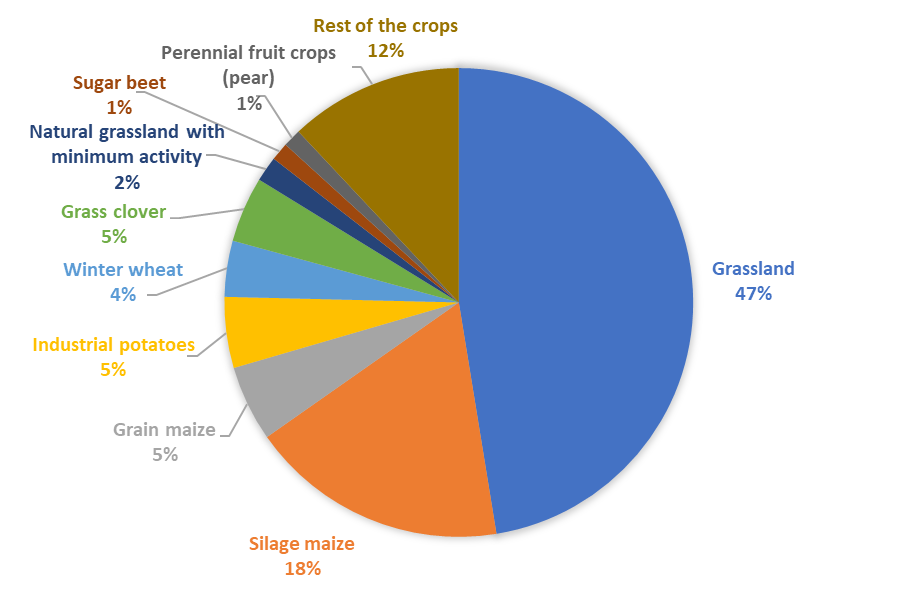
Figure 5:Dominant crops in poorly drained soils over Flanders based on a 4-year average all provinces combined.
In total, 72 % of the area with poorly drained soils is covered with natural or cultivated grass, and forage, which evidences that the main economical activity in these areas is livestock farming. This is logical since arable crops do not grow well in poorly drained soils, where soil saturation or waterlogging may occur (Impact of groundwater levels and waterlogging on cultivation factors). Therefore, the main target group for the agricultural workshops was livestock farmers.
When looking at the location of the Flagships projects, grassland and maize (mostly silage maize) are the predominant crops (Figure 6), which also relates to livestock farmers.
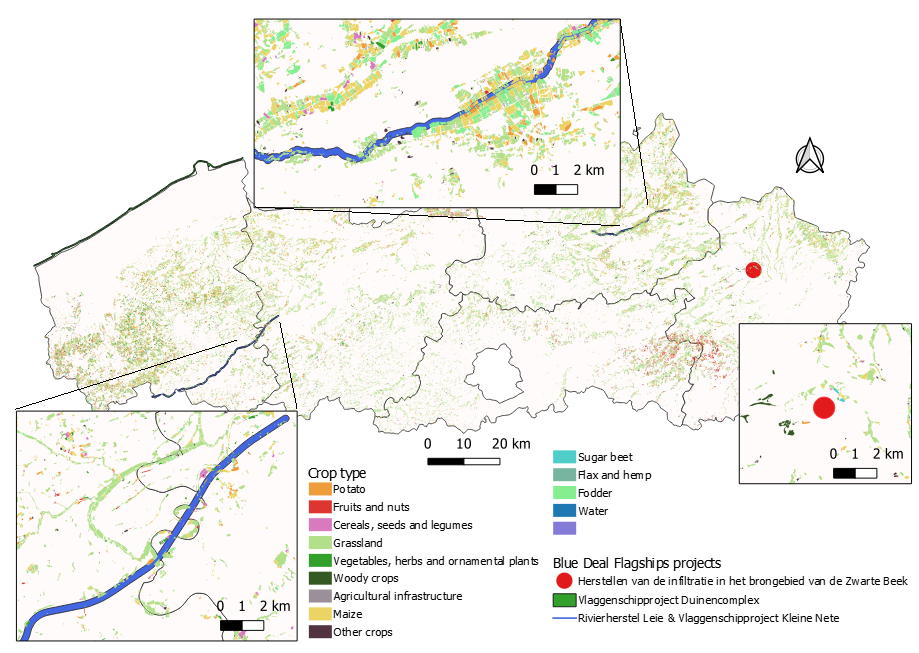
Figure 6:Agricultural use in poorly drained soils in the location of the Blue Deal Flagships projects.
Conclusions
The GIS analysis using available soil and land use maps gave a first idea of the dominant crops and soil types found in poorly drained areas. The most dominant crops were, grassland, maize, potatoes, winter wheat and sugar beet. The dominant soil textures were sandy loam, loamy sand and sand. Since about 72 % of the area is covered with grass and forage, the main economical activity in these areas is livestock farming. These results provide a good overview of the soil characteristics and agriculture in poorly drained soils, for modelling purposes and for targeting interested parties.
- VPO. (2017). Digitale bodemkaart van het Vlaams Gewest: bodemtypes. https://www.geopunt.be/catalogus/datasetfolder/a1547a01-b9fc-40fa-a2eb-009a39c02c7b
- LV, D. (2016). Landbouwgebruikspercelen. https://www.geopunt.be/catalogus/datasetfolder/47c5540f-bf7c-45fc-9a74-8e60547cde82
- Dondeyne, S., Vanierschot, L., Langohr, R., Ranst, E. V., & Deckers, J. (2014). The soil map of the Flemish region converted to the 3rd edition of the World Reference Base for soil resources. 10.13140/2.1.4381.4089